Collections of Stats
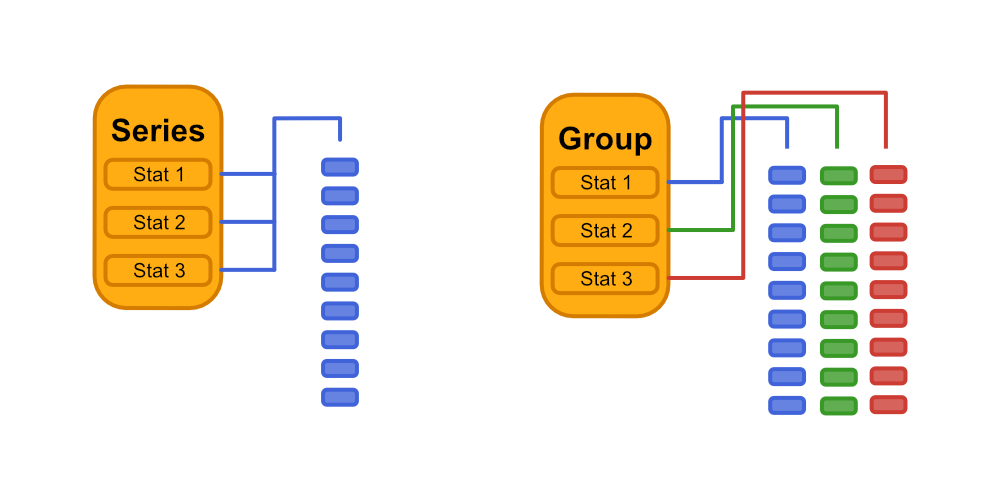
Series
A Series tracks stats that should be applied to the same data stream.
y = rand(1000)

s = Series(Mean(), Variance())
fit!(s, y)
Series
├── Mean: n=1000 | value=0.491257
└── Variance: n=1000 | value=0.086594FTSeries
An FTSeries tracks stats that should be applied to the same data stream, but filters and transforms (hence FT) the input data before it is sent to its stats.
s = FTSeries(Mean(), Variance(); filter = x->true, transform = abs)
fit!(s, -y)
FTSeries
├── Mean: n=1000 | value=0.491257
└── Variance: n=1000 | value=0.086594Group
A Group tracks stats that should be applied to different data streams.
g = Group(Mean(), CountMap(Bool))

itr = zip(randn(100), rand(Bool, 100))

fit!(g, itr)
Group
├── Mean: n=100 | value=-0.0635903
└── CountMap: n=100 | value=DataStructures.OrderedDict(true=>43,false=>57)